
Blog
What it really costs to own a home in Rhode Island in 2026
By Green Robot Research · October 27, 2026
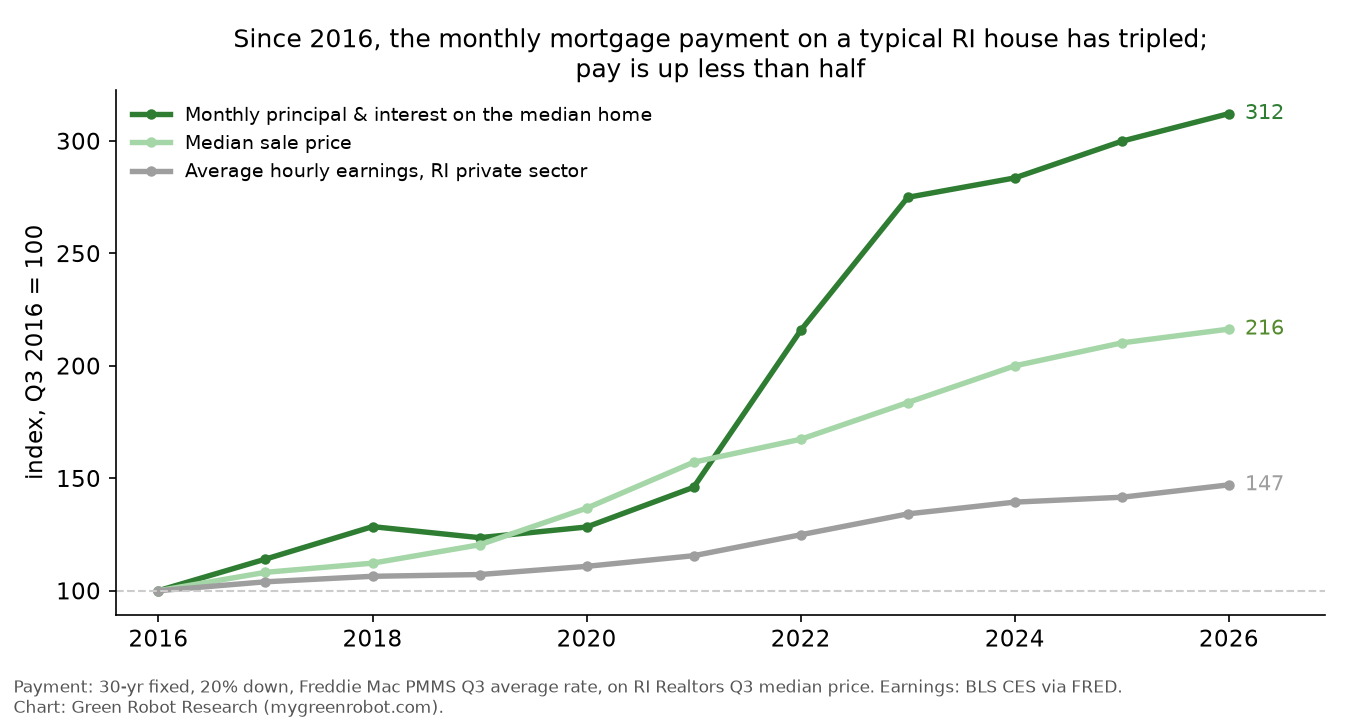
The short version: a typical Rhode Island single-family house sold for $530,000 this summer, more than double the price ten years ago. Because mortgage rates have also roughly doubled, the monthly loan payment on that house has more than tripled since 2016, while average pay in the state rose about 47%. Add property tax, insurance and this winter's higher electric rate, and a buyer of a median-priced home in most mainland towns is looking at roughly $3,100 to $3,700 a month before heating fuel and repairs.
Below is each piece of that bill, with the source linked next to every number.
1. The price of the house
Rhode Island's median single-family sale price was $530,000 in the third quarter of 2026 (July–September), up 3.1% from $514,000 a year earlier, while the number of sales fell 6.7% (RI Realtors, Q3 2026 single-family sales by county and town). In September alone the median reached $534,000, sales were down 11.7% from a year earlier, and the state had only a 2.9-month supply of homes for sale, about half of what is considered a balanced market (RI Realtors, Oct 19, 2026). Zillow's estimate of a typical Rhode Island home value (all homes, not just sales) was $508,507 in September 2026, up 3.5% in a year (Zillow Home Value Index, state data).
Ten years ago the third-quarter median was $245,000 (RI Realtors, Q3 2016 report). The price has risen every single year since 2015:
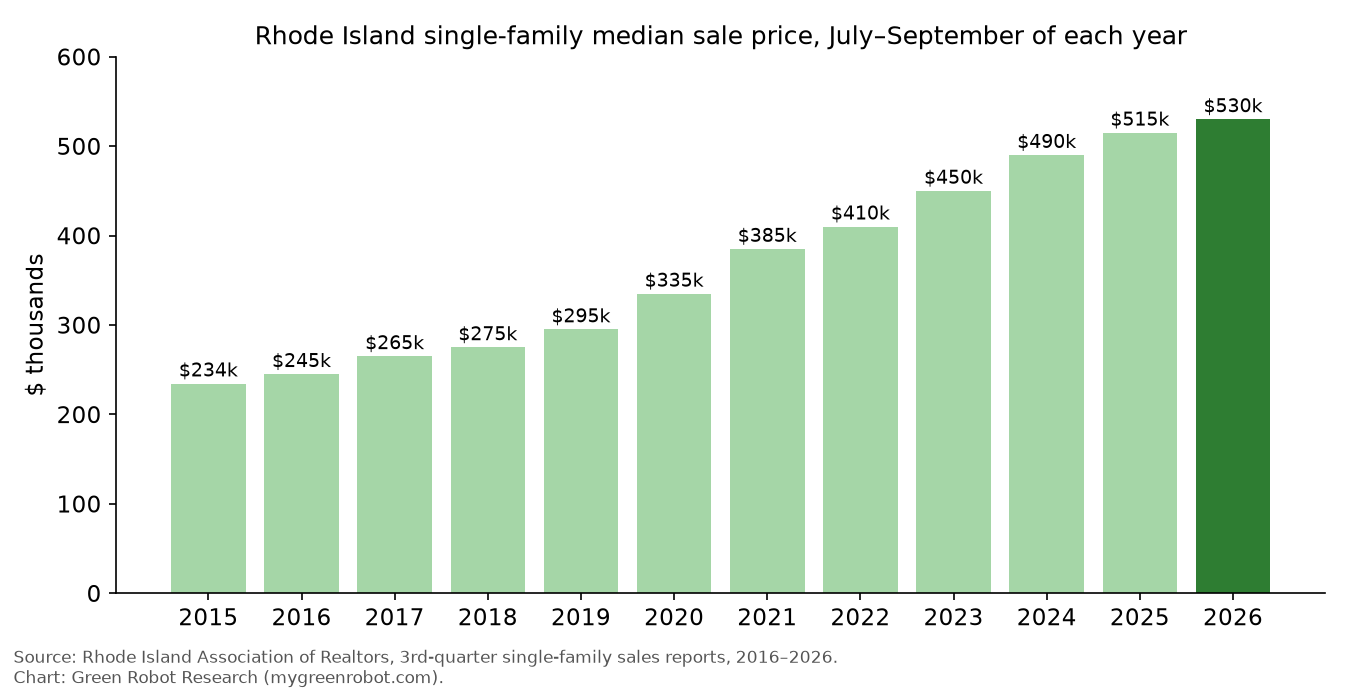
Each bar is taken from that year's third-quarter report from the Rhode Island Association of Realtors (2016, 2017, 2018, 2019, 2020, 2021, 2022, 2023, 2024, 2025, 2026); the 2015 figure is the prior-year column of the 2016 report.
By county and town
| Area | Q3 2026 median | Q3 2025 median | Change |
|---|---|---|---|
| Rhode Island | $530,000 | $514,000 | +3.1% |
| Bristol County | $800,000 | $697,000 | +14.8% |
| Newport County | $860,000 | $848,000 | +1.4% |
| Washington County | $745,000 | $687,450 | +8.4% |
| Kent County | $470,000 | $445,000 | +5.6% |
| Providence County | $480,000 | $460,000 | +4.3% |
Source: RI Realtors, Q3 2026 single-family report.
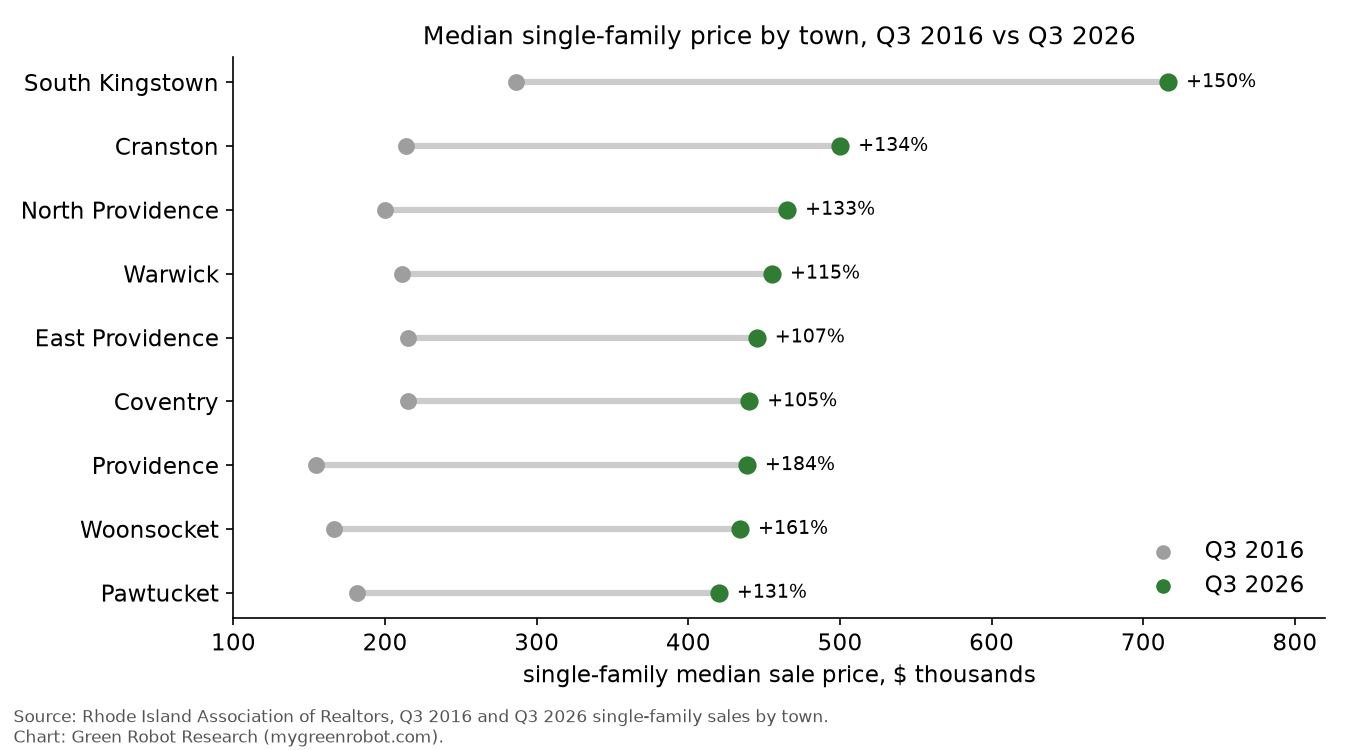
The most affordable places to buy a single-family home this summer were Central Falls ($362,500, on only two sales), Pawtucket ($420,000), Woonsocket ($433,950), Providence ($438,500) and Coventry ($440,000). At the top were Block Island ($2.07 million), Newport ($1.45 million), Jamestown ($1.27 million), Little Compton ($1.2 million) and Narragansett ($1.2 million) (same report).
Over ten years, the biggest jumps were in the cities that used to be the cheapest. Providence's median went from $154,500 to $438,500 (+184%) and Woonsocket's from $166,250 to $433,950 (+161%) (Q3 2016 vs. Q3 2026). Newport, not shown in the chart to keep the scale readable, went from $480,000 to $1,446,500.
2. The mortgage: rates are back above 7%
Freddie Mac's weekly survey put the average 30-year fixed rate at 7.32% on October 22, 2026, up from 6.19% a year earlier (October 23, 2025) (Freddie Mac PMMS history; FRED series MORTGAGE30US). Rhode Island's Realtors linked September's sales drop directly to rates moving past 7% (RI Realtors).
What that means on a $530,000 house with 20% down (a $424,000 loan), using the standard 30-year loan formula:
| 30-year rate | Monthly principal & interest |
|---|---|
| 6.19% (Oct 2025) | $2,594 |
| 7.32% (Oct 2026) | $2,913 |
That is $319 a month more for the same house, or about $3,800 a year, from the rate change alone.
Ten years of affordability
To compare like with like, we took each year's third-quarter median price from RI Realtors and that quarter's average Freddie Mac rate, and calculated the payment on a 30-year loan with 20% down. We set that against average hourly earnings for Rhode Island private-sector workers from the U.S. Bureau of Labor Statistics (BLS, via FRED series SMU44000000500000003).
| Q3 2016 | Q3 2026 | Change | |
|---|---|---|---|
| Median single-family price | $245,000 | $530,000 | +116% |
| Average 30-year rate (Jul–Sep) | 3.45% | 6.68% | +3.2 points |
| Monthly principal & interest | $875 | $2,730 | +212% |
| Average hourly earnings, RI private sector | $25.77 | $37.90 | +47% |
Against household income the picture is the same. Census Bureau estimates put Rhode Island's median household income at $60,046 in 2016 and $83,250 in 2024, the latest year available (Census SAIPE, via FRED series MHIRI44000A052NCEN). On those numbers, principal and interest on the median house took about 17.5% of median income in 2016 and 35.8% in 2024. Measured against the same 2024 income, the Q3 2026 payment would take about 39%, before taxes and insurance.
3. Property tax: it depends a lot on the town
Rhode Island's 39 municipalities set their own rates. For fiscal 2026 (assessment date December 31, 2024), residential rates ran from $4.79 per $1,000 of assessed value in Little Compton to $21.52 in Foster, with West Warwick's one-family rate at $22.62 (RI Division of Municipal Finance, FY2026 tax rates by class). Providence's $8.40 rate applies only to owner-occupied single-family homes; the non-owner-occupied rate is $14.60 (same table, note 5).
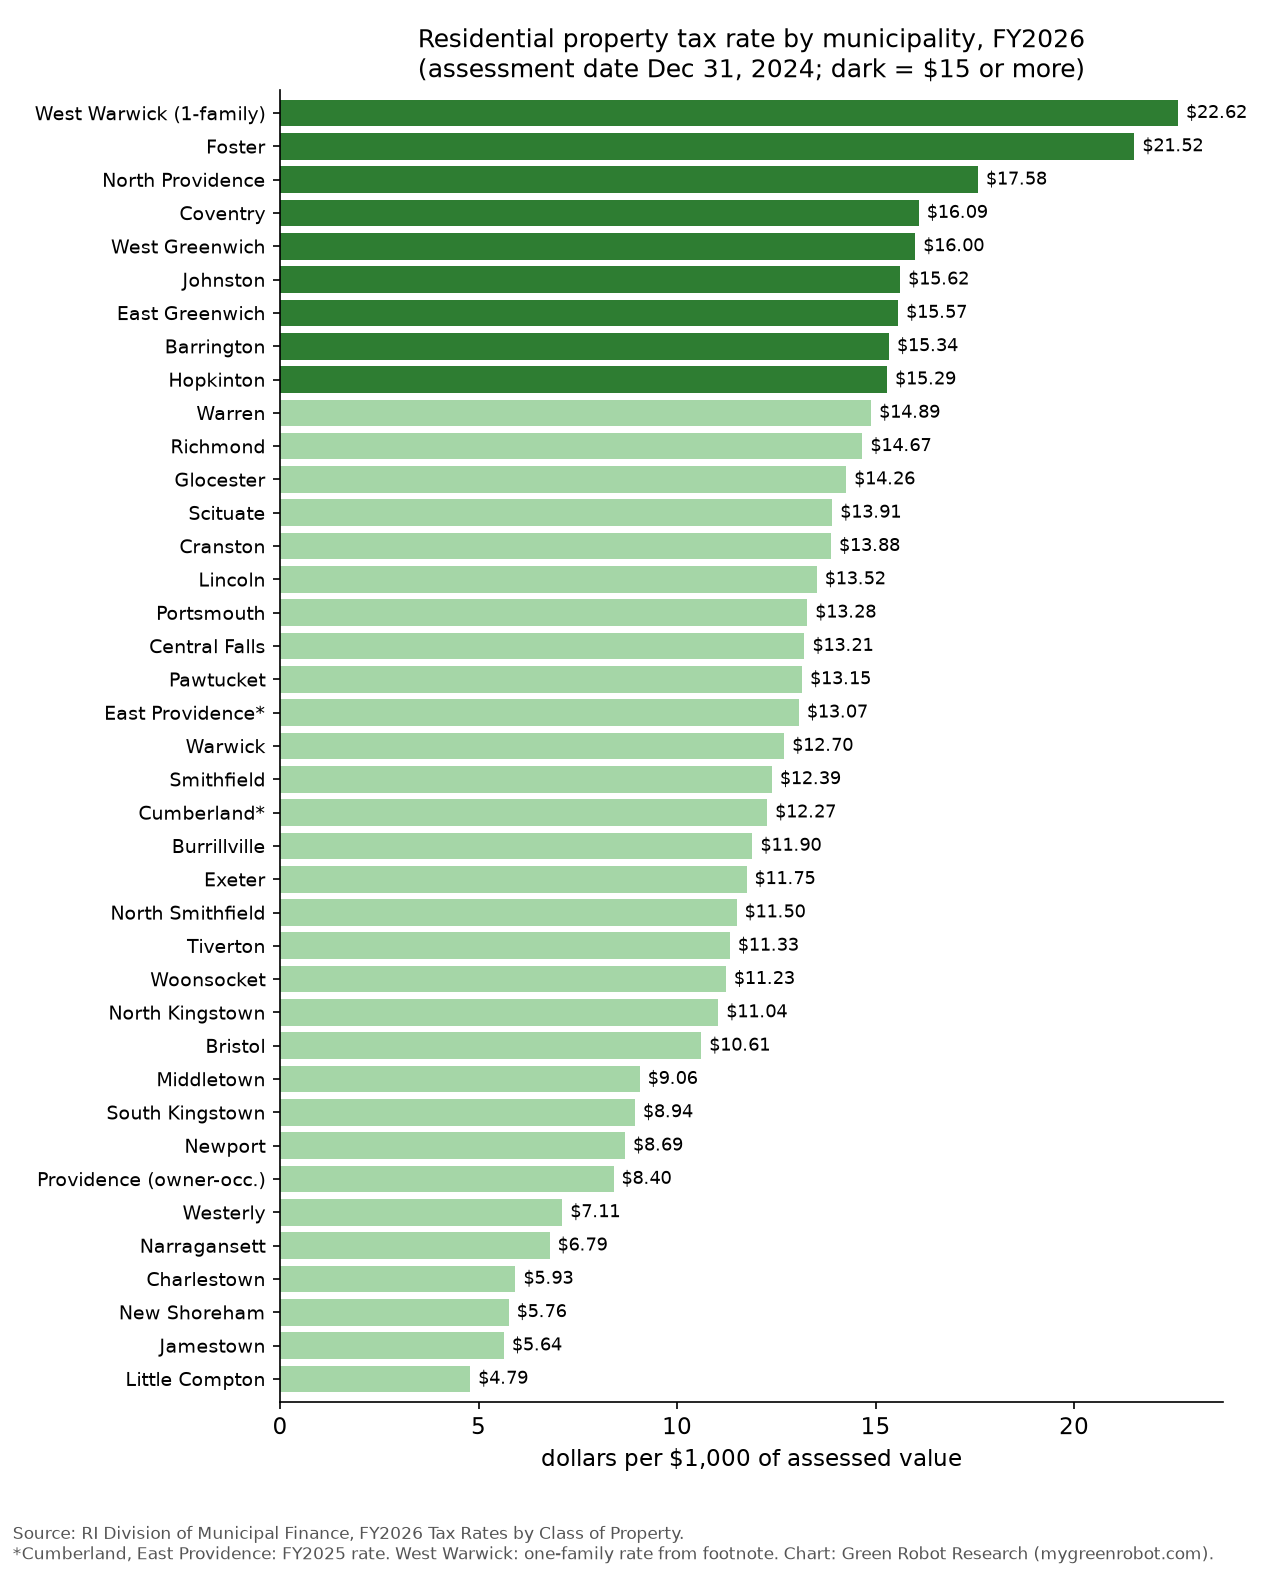
A low rate does not always mean a low bill: coastal towns with low rates have expensive houses. The Census Bureau's survey puts the median real estate tax paid by Rhode Island homeowners at $4,900 a year, compared with $3,119 nationally (2020–2024 five-year estimates) (American Community Survey table B25103, via Census Reporter).
FY2027 rates (on the December 31, 2025 assessment) had not yet been posted statewide by the Division of Municipal Finance when we checked on October 27, 2026 (tax rates page). Some cities have published their own; for example, Providence kept the $8.40 owner-occupied rate for FY2027 (Providence FY27 adopted ordinance).
4. Homeowners insurance: well above the national average
The average annual premium for a standard owner-occupied homeowners policy (form HO-3) in Rhode Island was $2,396 in 2023, the latest year in the national regulators' report, against $1,737 for the U.S. as a whole, about 38% more (NAIC Homeowners Insurance Report, data for 2023, Table 4). For Rhode Island homes insured for $500,000 to $599,999, the average HO-3 premium was $2,714 (same table).
Premiums have kept rising since then. One insurer's 2026 Rhode Island filing, for example, listed previous homeowners increases of 9.7% in 2023, 24.5% in 2024 and 11.6% in 2025 for its customers (ERRRA summary of TypTap filing). That is one company, not the whole market, so treat the 2023 statewide average as a floor rather than a quote.
5. Energy: this winter costs more
- Electricity. Rhode Island Energy's residential supply rate is 17.029¢ per kWh from October 1, 2026. For a typical home using 500 kWh a month, the bill is $179.96 as of October 1, 2026, according to the PUC's breakdown of a typical residential bill (RI PUC, Electric Bill Components 10-1-26). The new supply rate alone adds $30.93 a month (21.4%) for that customer, according to the company's July filing (RI PUC Docket 26-27-EL filing). Two approved bill credits soften it: $14.51 a month on every Rhode Island Energy electric account from October 2026 through September 2027 (RIPUC No. 2304, hold harmless credits), plus $20.45 a month on residential bills in January, February and March 2027 (Governor's office, Sept. 24, 2026).
- Heating oil. The U.S. Energy Information Administration's weekly survey had Rhode Island residential heating oil at $6.380 a gallon (excluding taxes) for October 19, 2026, up from $3.610 a year earlier (EIA weekly Rhode Island prices; EIA price history). Residential propane was $4.167 a gallon the same week (EIA).
- Across the region. Rhode Island has no consumer price index of its own. In the neighboring Boston metro area, energy prices were up 21.7% in the year to September 2026, shelter 4.0%, and owners' equivalent rent 4.4% (BLS CPI, Boston-Cambridge-Newton, September 2026).
6. Putting it together: an estimated monthly bill
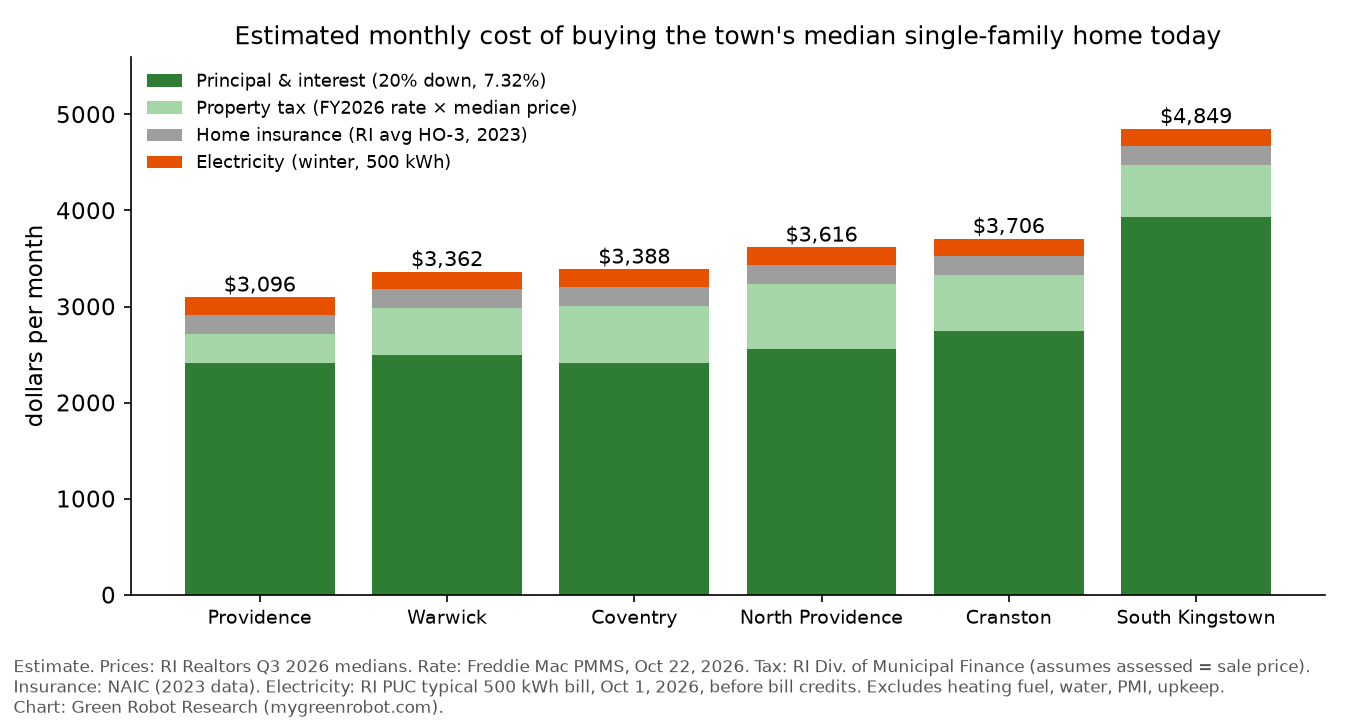
Here is what buying the median single-family house in six towns would cost per month today. It combines the four costs above that we could source for every town. This is an estimate, not a quote. It assumes 20% down at Freddie Mac's October 22 rate of 7.32%, and a tax bill based on assessment equal to the sale price (actual assessments are often lower). Insurance is the statewide 2023 average, and electricity is the PUC's typical 500 kWh bill as of October 1, 2026 ($179.96), before the bill credits described above. It leaves out heating fuel, water and sewer, private mortgage insurance and maintenance.
| Town | Q3 2026 median | Principal & interest | Property tax | Insurance | Electricity | Total / month |
|---|---|---|---|---|---|---|
| Providence (owner-occ.) | $438,500 | $2,410 | $307 | $200 | $180 | $3,096 |
| Warwick | $455,000 | $2,500 | $482 | $200 | $180 | $3,362 |
| Coventry | $440,000 | $2,418 | $590 | $200 | $180 | $3,388 |
| North Providence | $465,000 | $2,555 | $681 | $200 | $180 | $3,616 |
| Cranston | $500,000 | $2,748 | $578 | $200 | $180 | $3,706 |
| South Kingstown | $716,250 | $3,936 | $534 | $200 | $180 | $4,849 |
Sources: prices from RI Realtors Q3 2026; rate from Freddie Mac PMMS; tax rates from the RI Division of Municipal Finance; insurance from NAIC; electricity from the RI PUC bill components, Oct. 1, 2026. Totals may differ by $1 due to rounding.
7. Existing owners vs. new buyers
People who bought years ago, or own outright, pay far less than these estimates. In 2024, Rhode Island's median monthly owner costs (mortgage, taxes, insurance, utilities and fees) were $2,262 for homes with a mortgage and $926 without one, against a median household income of $83,504 (American Community Survey 2024 1-year, tables B25088 and B19013, via Census Reporter). Even so, 34% of Rhode Island owners with a mortgage spent 30% or more of their income on housing costs, the usual threshold for being "cost-burdened," and so did about 20% of owners without a mortgage (our calculation from ACS table B25091).
By county, using the five-year 2020–2024 survey (ACS 2024 5-year, via Census Reporter):
| County | Median household income | Median home value | Monthly owner costs, with mortgage | Without mortgage | Homeownership rate |
|---|---|---|---|---|---|
| Bristol | $114,490 | $513,800 | $2,509 | $1,061 | 71.8% |
| Kent | $94,345 | $366,100 | $2,195 | $868 | 73.1% |
| Newport | $103,514 | $609,700 | $2,622 | $1,030 | 67.9% |
| Providence | $78,787 | $373,600 | $2,152 | $872 | 56.9% |
| Washington | $106,638 | $510,800 | $2,364 | $947 | 77.5% |
| Rhode Island | $87,796 | $404,200 | $2,234 | $898 | 63.6% |
Statewide row also matches Census QuickFacts. Five-year estimates average 2020–2024 and lag current prices, which is why the home values are well below 2026 sale prices.
8. Free ways to lower the cost
- Claim every exemption your town offers. Many Rhode Island municipalities tax owner-occupied homes at a lower rate or give a homestead exemption, but you usually have to apply. In Providence, for example, the application is due to the assessor by March 15 for the owner-occupied rate (Providence FY27 ordinance). Call your assessor and ask what you qualify for and how to appeal an assessment you think is too high.
- If you are 65+ or disabled with household income of $40,730 or less, file Form RI-1040H. The state property tax relief credit was worth up to $700 for 2025. Claims are due by April 15 of the following year (April 15, 2026 for 2025), and you can file even if you don't file an income tax return (RI Division of Taxation, 2025 RI-1040H).
- Get several mortgage quotes and compare Loan Estimates. In federal data, offers to the same borrower (700 credit score, 10% down, 30-year fixed) ranged from 5.875% to 8.125% (CFPB, Explore interest rates). Comparing quotes costs nothing.
- First-time buyers: check RIHousing assistance before you make an offer. Programs include $15,000 in 0% down-payment help (15kDPA), up to $20,000 or 6% of the price (Extra Assistance), and $25,000 for eligible first-generation buyers from certain cities that is forgiven after five years (FirstGenHomeRI) (RIHousing homebuyer programs).
- Shop your homeowners insurance at renewal. Rhode Island premiums vary widely by company and coverage level (NAIC). Ask about a higher deductible and bundling, and read the renewal notice carefully. A 2026 bill introduced at the State House (H7066) would require 60 days' notice for renewal increases above 20% (RI General Assembly).
- Book a free home energy audit. Rhode Island Energy offers one to residential customers (RI PUC filing), and it's the cheapest way to find where heat is leaking with heating oil above $6 a gallon.
How we calculated
- Monthly principal and interest uses the standard fixed-rate formula, P × i / (1 − (1 + i)^−360), where P is 80% of the median price and i is the annual rate ÷ 12. It excludes taxes, insurance and PMI.
- Quarterly mortgage rate is the simple average of Freddie Mac's weekly 30-year readings from July through September (FRED MORTGAGE30US).
- Hourly earnings are the July–September average of the BLS monthly series for Rhode Island's private sector (FRED SMU44000000500000003).
- Medians are medians. RI Realtors notes that a median sale price reflects which homes sold, and is not a measure of how much an individual home's value changed (Q3 2026 report footnote). Towns with few sales (Central Falls, Block Island) can swing a lot.
Our full process for sourcing and correcting data is on the Methodology page.
About Green Robot Research. Green Robot Research is the research section of Green Robot (mygreenrobot.com), led by founder Rafael Escobar. It publishes Rhode Island household-cost data built only from public sources, each one linked, and explains how it checks and corrects data on its Methodology page.
Sources
- Rhode Island Association of Realtors, Q3 single-family sales by county and town, 2016–2026: https://www.rhodeislandliving.com/RealtorResources/SalesStats/Documents/3rdQ-Single2026.pdf (and the same path for 2016–2025)
- Rhode Island Association of Realtors, "September Rate Hike Slows R.I. Home Sales" (Oct 19, 2026): https://www.rirealtors.org/news/2026/10/19/press-release/september-rate-hike-slows-r.i.-home-sales/
- Zillow Research, Zillow Home Value Index (state, all homes, smoothed and seasonally adjusted): https://www.zillow.com/research/data/
- Freddie Mac, Primary Mortgage Market Survey: https://www.freddiemac.com/pmms ; FRED MORTGAGE30US: https://fred.stlouisfed.org/series/MORTGAGE30US
- U.S. Bureau of Labor Statistics, Current Employment Statistics, average hourly earnings, RI total private (FRED SMU44000000500000003): https://fred.stlouisfed.org/series/SMU44000000500000003
- U.S. Census Bureau, Small Area Income and Poverty Estimates, RI median household income (FRED MHIRI44000A052NCEN): https://fred.stlouisfed.org/series/MHIRI44000A052NCEN
- U.S. Census Bureau, American Community Survey 2024 1-year and 2020–2024 5-year (tables B19013, B25003, B25077, B25088, B25091, B25103), via Census Reporter: https://censusreporter.org/profiles/04000US44-rhode-island/
- U.S. Census Bureau, QuickFacts Rhode Island: https://www.census.gov/quickfacts/fact/table/RI
- RI Division of Municipal Finance, FY2026 Rhode Island Tax Rates by Class of Property: https://municipalfinance.ri.gov/sites/g/files/xkgbur546/files/2025-11/2025-Tax-Rates-12-31-24%20Final.pdf
- City of Providence, FY27 adopted ordinance book: https://www.providenceri.gov/wp-content/uploads/2026/06/FY27-Adopted-Ordinance-Book-Web.pdf
- NAIC, Dwelling Fire, Homeowners Owner-Occupied, and Homeowners Tenant and Condominium/Cooperative Unit Owner's Insurance Report: Data for 2023: https://content.naic.org/sites/default/files/publication-hmr-zu-homeowners-report.pdf
- ERRRA, "TypTap Seeks 6% Rhode Island Homeowners Rate Increase" (May 10, 2026): https://errra.com/typtap-seeks-6-rhode-island-homeowners-rate-increase/
- RI PUC, Docket 26-27-EL LRS winter rates filing: https://ripuc.ri.gov/sites/g/files/xkgbur841/files/2026-07/26-27-EL%20-%20LRS%202026%20Winter%20Rates%20%28R%29%28PUC%207-22-26%29.pdf
- RI PUC, Rhode Island Energy Electric Bill Components (Oct 1, 2026): https://ripuc.ri.gov/sites/g/files/xkgbur841/files/2026-10/Rhode%20Island%20Energy%20Electric%20Bill%20Components%20%2810-1-26%29.pdf
- Rhode Island Energy, RIPUC No. 2304, Hold Harmless Implementation Agreement Miscellaneous Bill Credits (eff. Oct 1, 2026): https://www.rienergy.com/site/-/media/rie-jss-app/home/ways-to-save/rates-and-shopping/service-rates/residential-rates/tariff-provisions/tariff-provisions/Tariff-No-2304--Hold-Harmless-Credits--Eff.pdf
- Office of the Governor, "PUC Approves Governor McKee's $28 Million in Winter Electric Bill Relief" (Sept 24, 2026): https://governor.ri.gov/press-releases/puc-approves-governor-mckees-28-million-winter-electric-bill-relief
- U.S. EIA, Weekly heating oil and propane prices, Rhode Island: https://www.eia.gov/dnav/pet/PET_PRI_WFR_DCUS_SRI_W.htm
- U.S. BLS, CPI Boston-Cambridge-Newton, September 2026: https://www.bls.gov/regions/northeast/news-release/consumerpriceindex_boston.htm
- RI Division of Taxation, 2025 Form RI-1040H: https://tax.ri.gov/sites/g/files/xkgbur541/files/2026-01/2025%201040H_w.pdf
- CFPB, Explore interest rates: https://www.consumerfinance.gov/owning-a-home/explore-rates/
- RIHousing, homebuyer programs: https://www.rihousing.com/homebuyers/
- RI General Assembly, 2026 H 7066: https://webserver.rilegislature.gov/BillText26/HouseText26/H7066.pdf
Charts by Green Robot Research from the public data above. Free to reuse with credit: "Chart: Green Robot Research (mygreenrobot.com)". Chart code: make_charts_home.py.