

Blog
Rhode Island gardening and yard calendar: frost dates by town, hardiness zones and a month-by-month lawn guide
By Rafael Escobar, founder of Green Robot, 7 years in landscaping · October 27, 2026
The short version: In Rhode Island, a spring freeze can come weeks later in some places than in others. At the Providence weather station at T.F. Green Airport in Warwick, the last 32°F night of spring falls on or before April 11 in half of years. At Kingston, in South Kingstown, the date is May 3. The first fall freeze follows the same pattern: October 30 at T.F. Green and October 8 at Kingston. That gives the coast and the Providence area a growing season of about 200 to 216 days, compared with 159 to 179 days at inland stations (NOAA NCEI, U.S. Climate Normals 1991–2020). On the 2023 USDA plant hardiness map, 20 of the state's 39 cities and towns are mostly zone 7a, 18 are mostly 6b and New Shoreham (Block Island) is 7b (USDA ARS / PRISM, 2023 ZIP-code data). URI Extension's planting calendar uses May 15 as Rhode Island's final frost date. At every station except Kingston, the chance of a 32°F freeze after that date is below 10%.
This guide covers frost dates for each station and town, the odds behind them, your hardiness zone, and a month-by-month yard calendar with a source for every item.
1. Frost dates by weather station
Weather services use three cold thresholds. Rhode Island's Department of Environmental Management calls 36°F a frost, 32°F a freeze and 28°F a hard freeze (RI DEM, Frost Climatology). Tender plants can be hurt on a 36°F night, because ground-level leaves get colder than the air at thermometer height.
NOAA's National Centers for Environmental Information (NCEI) publishes these dates as probabilities rather than a single average, based on 1991–2020 observations. In this article, the median is the date with a 50/50 chance. The 1-in-10 date in spring is the date with only a 10% chance of a freeze on or after it. In fall it is the date with only a 10% chance of a freeze on or before it (NCEI annual/seasonal normals, station files; methodology).
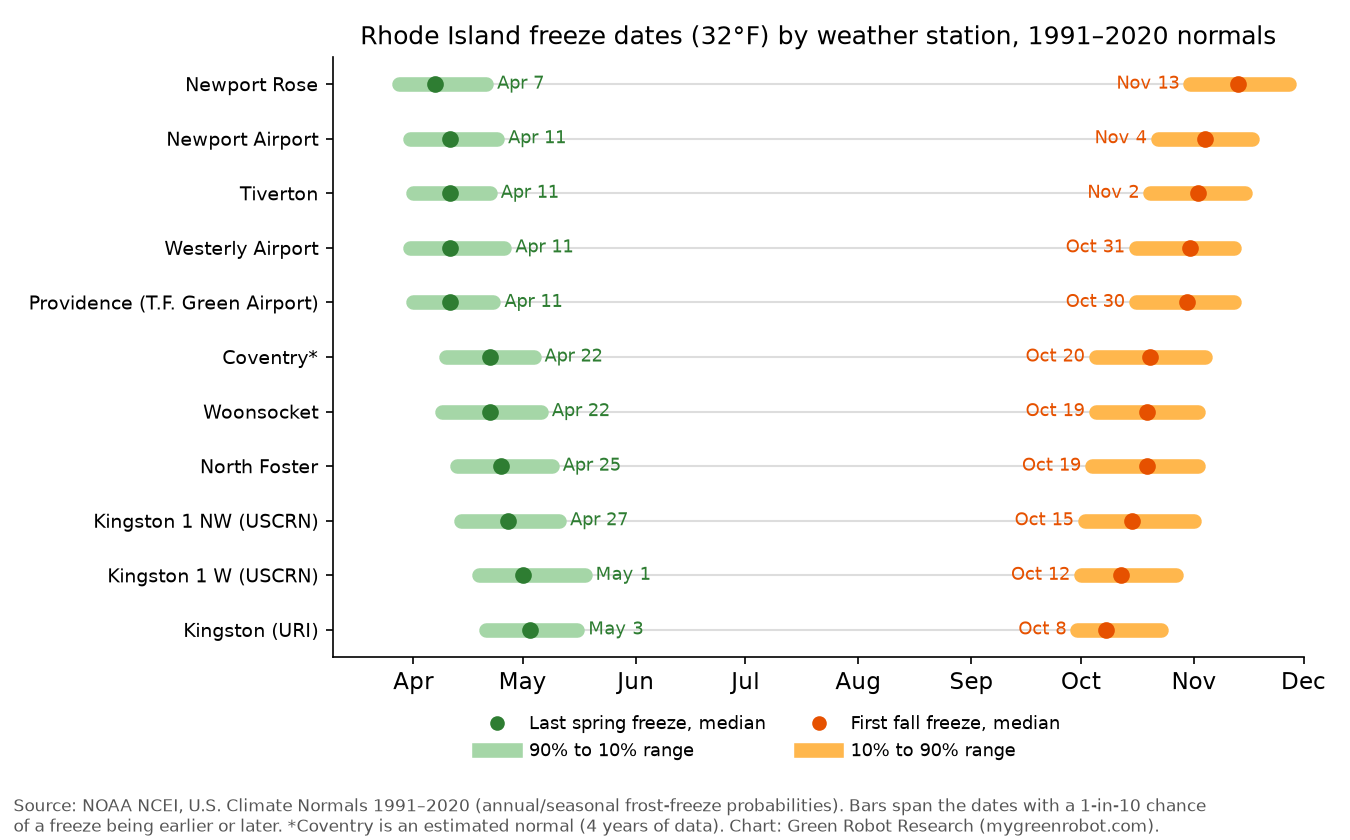
Source: NOAA NCEI, U.S. Climate Normals 1991–2020, annual/seasonal frost-freeze probabilities, station files for the 11 Rhode Island stations with frost normals.
Freeze dates (32°F) at Rhode Island weather stations, 1991–2020
| Station (town) | Last spring freeze, median | 1-in-10 chance of a later one | First fall freeze, median | 1-in-10 chance of an earlier one | Days between, median | Data quality (years) |
|---|---|---|---|---|---|---|
| Newport Rose (Newport) | Apr 7 | Apr 21 | Nov 13 | Oct 31 | 216 | Representative (11) |
| Newport State Airport (Middletown) | Apr 11 | Apr 24 | Nov 4 | Oct 22 | 206 | Representative (23) |
| Tiverton | Apr 11 | Apr 22 | Nov 2 | Oct 20 | 203 | Representative (18) |
| Westerly State Airport | Apr 11 | Apr 26 | Oct 31 | Oct 16 | 201 | Representative (19) |
| Providence, T.F. Green Airport (Warwick) | Apr 11 | Apr 23 | Oct 30 | Oct 16 | 199 | Standard (30) |
| Coventry | Apr 22 | May 4 | Oct 20 | Oct 5 | 179 | Estimated (4) |
| Woonsocket | Apr 22 | May 6 | Oct 19 | Oct 5 | 179 | Representative (16) |
| North Foster (Foster) | Apr 25 | May 9 | Oct 19 | Oct 4 | 176 | Standard (29) |
| Kingston 1 NW, reference network (South Kingstown) | Apr 27 | May 11 | Oct 15 | Oct 2 | 171 | Representative (19) |
| Kingston 1 W, reference network (South Kingstown) | May 1 | May 18 | Oct 12 | Oct 1 | 163 | Representative (19) |
| Kingston, URI (South Kingstown) | May 3 | May 16 | Oct 8 | Sep 30 | 159 | Standard (29) |
| Block Island (New Shoreham)* | Apr 6 (average) | n/a | Nov 12 (average) | n/a | n/a | RI DEM, 1981–2010 |
Source: NOAA NCEI 1991–2020 annual/seasonal normals. "Standard" normals use at least 24 years of data. "Representative" normals use at least 10 years, with gaps filled from neighboring stations, and "estimated" normals use as few as 2 years (NCEI documentation). *NCEI publishes no frost normals for Block Island. Its row shows RI DEM's average dates from the 1981–2010 normals (RI DEM, Frost Climatology).
The stations split in two. Near the bay and ocean (Newport, Tiverton, Westerly, Warwick) the last freeze comes around April 7–11. Inland (Woonsocket, Foster, Coventry, Kingston) it comes 11 to 22 days later. Kingston is the state's cold spot. Two federal Climate Reference Network stations near the URI campus also show late freezes (April 27 and May 1), so it is not one faulty instrument.
The other two thresholds, medians (1991–2020)
| Station | Last 36°F frost | First 36°F frost | Last 28°F hard freeze | First 28°F hard freeze |
|---|---|---|---|---|
| Providence, T.F. Green | Apr 26 | Oct 18 | Apr 1 | Nov 9 |
| Newport State Airport | Apr 27 | Oct 24 | Mar 31 | Nov 16 |
| Westerly State Airport | Apr 27 | Oct 17 | Mar 29 | Nov 11 |
| Woonsocket | May 5 | Oct 7 | Apr 7 | Oct 31 |
| North Foster | May 7 | Oct 7 | Apr 12 | Oct 30 |
| Kingston, URI | May 14 | Oct 1 | Apr 20 | Oct 20 |
Source: NOAA NCEI 1991–2020 annual/seasonal normals, 50% probability values.
Records show how far individual years can stray. RI DEM lists a 32°F freeze at Kingston as late as June 3, 1986, and a fall freeze as early as September 10, 1938. At T.F. Green the latest spring freeze on record was May 9, 1956 and the earliest fall freeze was September 30, 1951. Kingston has recorded a 36°F frost as late as June 19, 1939 (RI DEM, Frost Climatology).
2. Frost dates and hardiness zone by city and town
Most towns have no weather station of their own. The table below pairs each town with the nearest station that has 1991–2020 frost normals, measured from the town's geographic center, and with its 2023 hardiness zone. Use it as a starting point; see Data limitations for why your own yard may differ.
Rhode Island cities and towns: nearest frost station and 2023 hardiness zone
| Town | Main zone (2023) | Nearest station (miles) | Last 32°F, median | Last 32°F, 1-in-10 | First 32°F, median | First 32°F, 1-in-10 |
|---|---|---|---|---|---|---|
| Barrington | 7a | Providence/T.F. Green (5.9) | Apr 11 | Apr 23 | Oct 30 | Oct 16 |
| Bristol | 7a | Tiverton (4.7) | Apr 11 | Apr 22 | Nov 2 | Oct 20 |
| Burrillville | 6b | North Foster (8.1) | Apr 25 | May 9 | Oct 19 | Oct 4 |
| Central Falls | 7a | Woonsocket (8.2) | Apr 22 | May 6 | Oct 19 | Oct 5 |
| Charlestown | 7a | Westerly (6.3) | Apr 11 | Apr 26 | Oct 31 | Oct 16 |
| Coventry | 6b | North Foster (11.5) | Apr 25 | May 9 | Oct 19 | Oct 4 |
| Cranston | 6b / 7a | Providence/T.F. Green (4.3) | Apr 11 | Apr 23 | Oct 30 | Oct 16 |
| Cumberland | 6b | Woonsocket (3.8) | Apr 22 | May 6 | Oct 19 | Oct 5 |
| East Greenwich | 7a | Providence/T.F. Green (6.8) | Apr 11 | Apr 23 | Oct 30 | Oct 16 |
| East Providence | 7a | Providence/T.F. Green (6.6) | Apr 11 | Apr 23 | Oct 30 | Oct 16 |
| Exeter | 6b | Kingston (7.0) | May 3 | May 16 | Oct 8 | Sep 30 |
| Foster | 6b | North Foster (4.7) | Apr 25 | May 9 | Oct 19 | Oct 4 |
| Glocester | 6b | North Foster (3.5) | Apr 25 | May 9 | Oct 19 | Oct 4 |
| Hopkinton | 6b | Westerly (9.2) | Apr 11 | Apr 26 | Oct 31 | Oct 16 |
| Jamestown | 7a | Newport Rose (1.7) | Apr 7 | Apr 21 | Nov 13 | Oct 31 |
| Johnston | 6b | Providence/T.F. Green (8.6) | Apr 11 | Apr 23 | Oct 30 | Oct 16 |
| Lincoln | 6b | Woonsocket (5.2) | Apr 22 | May 6 | Oct 19 | Oct 5 |
| Little Compton | 7a | Newport Airport (6.4) | Apr 11 | Apr 24 | Nov 4 | Oct 22 |
| Middletown | 7a | Newport Airport (0.9) | Apr 11 | Apr 24 | Nov 4 | Oct 22 |
| Narragansett | 7a | Kingston (7.0) | May 3 | May 16 | Oct 8 | Sep 30 |
| New Shoreham | 7b | Block Island, RI DEM (n/a) | Apr 6 (avg.) | n/a | Nov 12 (avg.) | n/a |
| Newport | 7a | Newport Rose (2.3) | Apr 7 | Apr 21 | Nov 13 | Oct 31 |
| North Kingstown | 7a | Newport Rose (7.2) | Apr 7 | Apr 21 | Nov 13 | Oct 31 |
| North Providence | 6b | Woonsocket (8.7) | Apr 22 | May 6 | Oct 19 | Oct 5 |
| North Smithfield | 6b | Woonsocket (2.8) | Apr 22 | May 6 | Oct 19 | Oct 5 |
| Pawtucket | 7a | Woonsocket (9.7) | Apr 22 | May 6 | Oct 19 | Oct 5 |
| Portsmouth | 7a | Newport Airport (4.1) | Apr 11 | Apr 24 | Nov 4 | Oct 22 |
| Providence | 7a (part 6b) | Providence/T.F. Green (7.0) | Apr 11 | Apr 23 | Oct 30 | Oct 16 |
| Richmond | 6b | Kingston (6.5) | May 3 | May 16 | Oct 8 | Sep 30 |
| Scituate | 6b | North Foster (6.0) | Apr 25 | May 9 | Oct 19 | Oct 4 |
| Smithfield | 6b | Woonsocket (6.1) | Apr 22 | May 6 | Oct 19 | Oct 5 |
| South Kingstown | 7a (part 6b) | Kingston (5.5) | May 3 | May 16 | Oct 8 | Sep 30 |
| Tiverton | 7a | Tiverton (1.9) | Apr 11 | Apr 22 | Nov 2 | Oct 20 |
| Warren | 7a | Tiverton (7.3) | Apr 11 | Apr 22 | Nov 2 | Oct 20 |
| Warwick | 7a | Providence/T.F. Green (1.4) | Apr 11 | Apr 23 | Oct 30 | Oct 16 |
| West Greenwich | 6b | Kingston (11.3) | May 3 | May 16 | Oct 8 | Sep 30 |
| West Warwick | 6b | Providence/T.F. Green (5.4) | Apr 11 | Apr 23 | Oct 30 | Oct 16 |
| Westerly | 7a | Westerly (1.8) | Apr 11 | Apr 26 | Oct 31 | Oct 16 |
| Woonsocket | 6b | Woonsocket (1.3) | Apr 22 | May 6 | Oct 19 | Oct 5 |
Sources: NOAA NCEI 1991–2020 normals; RI DEM (Block Island); zones from USDA ARS / PRISM 2023 ZIP-code data matched to towns with the Census 2020 ZCTA–county subdivision file. Town centers from the Census 2023 Gazetteer. Coventry's own station is left out of the matching because its normal rests on 4 years of data. Green Robot Research's matching, not an official NOAA product.
Nearest is not always most similar. Coastal Narragansett is matched to Kingston, the coldest station, and Pawtucket and Central Falls to Woonsocket, slightly closer than T.F. Green. Gardeners there may want to compare both stations.
3. How risky is planting early?

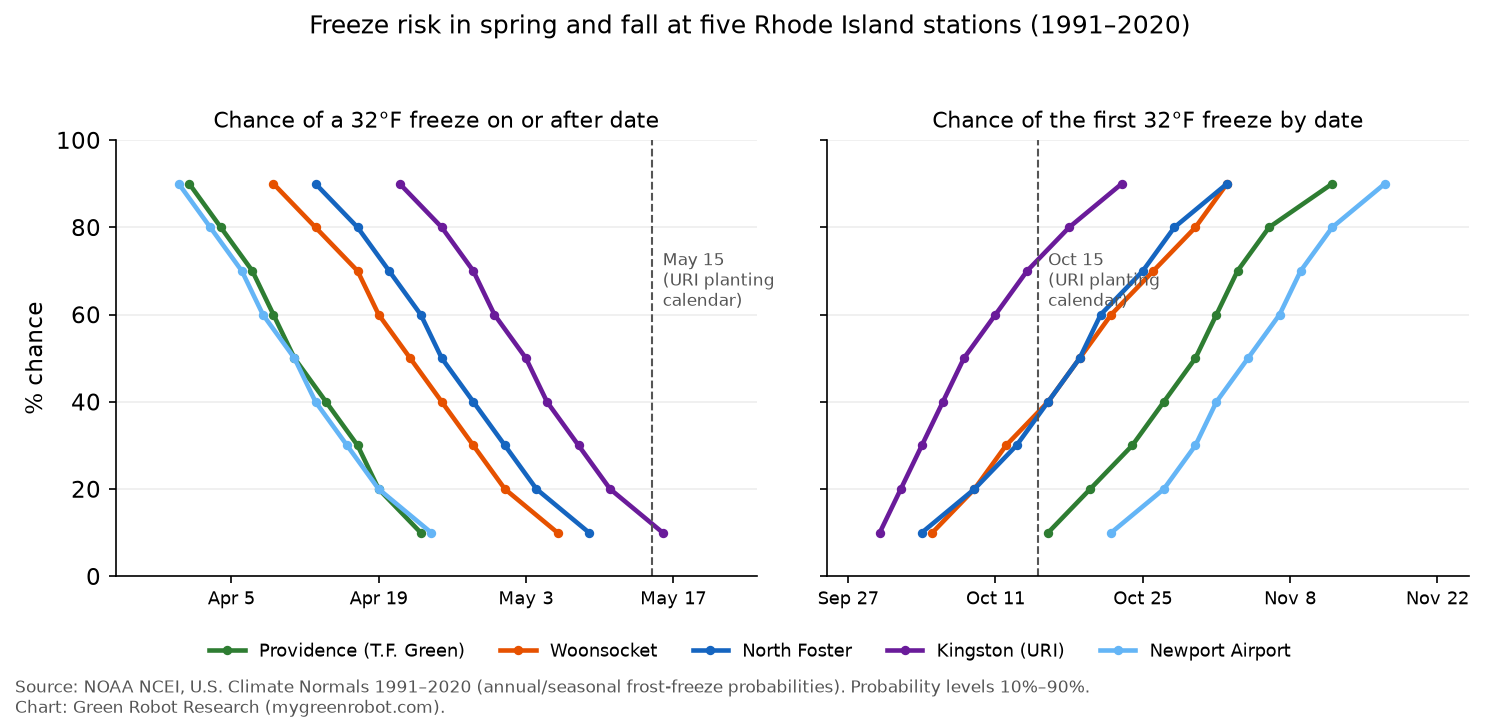
Source: NOAA NCEI 1991–2020 annual/seasonal normals, 10%–90% probability levels for the 32°F threshold.
The curves show the odds of a freeze moving through the season. At T.F. Green, the chance of a 32°F freeze on or after a given date falls from 90% on April 1 to 10% on April 23. At Kingston the same drop runs from April 21 to May 16. Monthly normals put it more plainly. The chance of at least one night at or below 32°F in May is 1.8% at T.F. Green, 23% at Woonsocket, 31% at North Foster and 58% at Kingston. For a 36°F frost in May, the chances are 28%, 67%, 75% and 89% (NCEI monthly normals, station files).
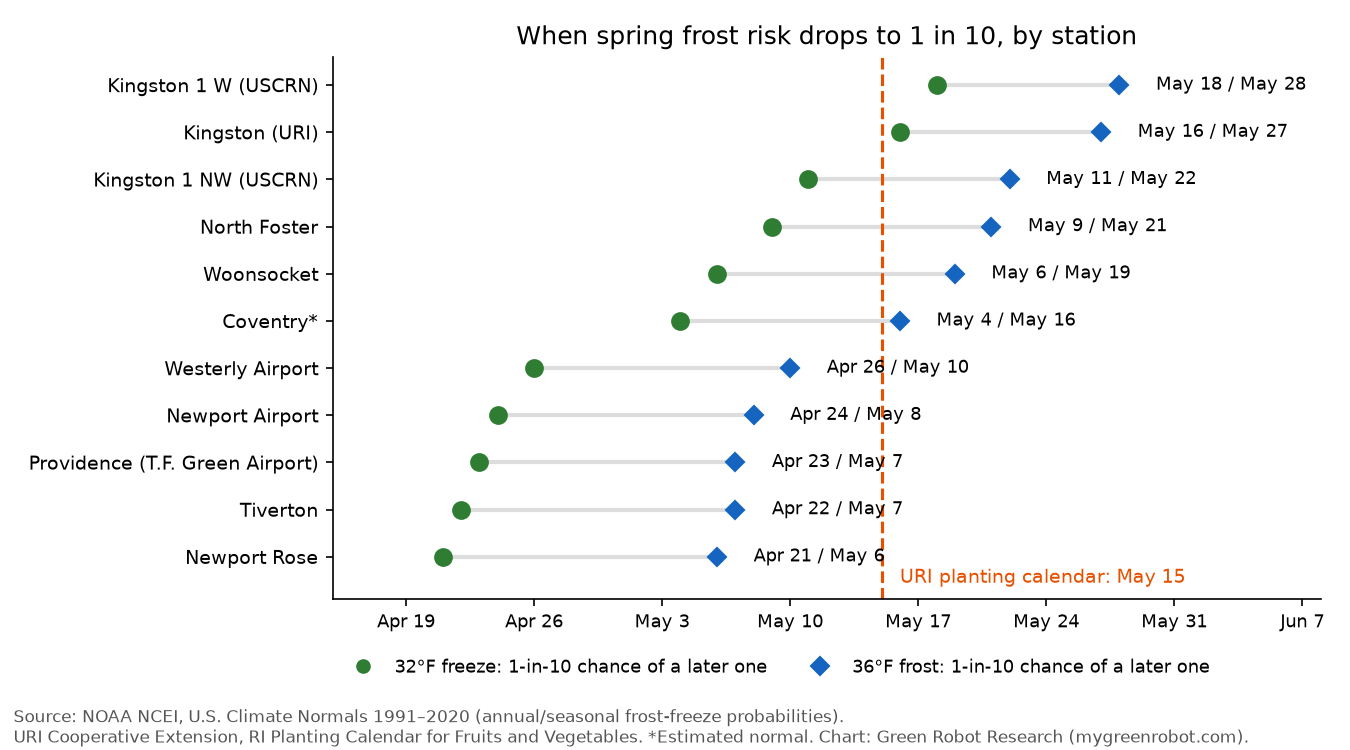
Sources: NOAA NCEI 1991–2020 normals; URI Cooperative Extension, RI Planting Calendar for Fruits and Vegetables.
URI's planting calendar states that its dates "are based on final frost on May 15 and first frost on October 15." Its windows for tender transplants such as tomatoes and peppers begin around late May (URI planting calendar). The NCEI data supports May 15 as a cautious statewide date. It falls after the 1-in-10 date for a 32°F freeze at every station except Kingston (May 16) and the nearby Kingston 1 W reference station (May 18). For a 36°F frost, the 1-in-10 dates run from May 6 at Newport Rose to May 27 at Kingston (May 28 at the nearby Kingston 1 W station). That is why frost-tender seedlings in inland valleys benefit from waiting until late May or from a cover on cold nights. Coastal and Providence-area gardeners face lower odds. At T.F. Green the 1-in-10 date for a 36°F frost is May 7.
URI's October 15 date falls after the median first 32°F freeze at Kingston (Oct. 8) but before the median at North Foster and Woonsocket (Oct. 19) and well before T.F. Green (Oct. 30). Inland, a 36°F frost often comes earlier still. Its median is October 1 at Kingston, and Kingston has a 47% chance of a 36°F night in September.
4. Growing season length
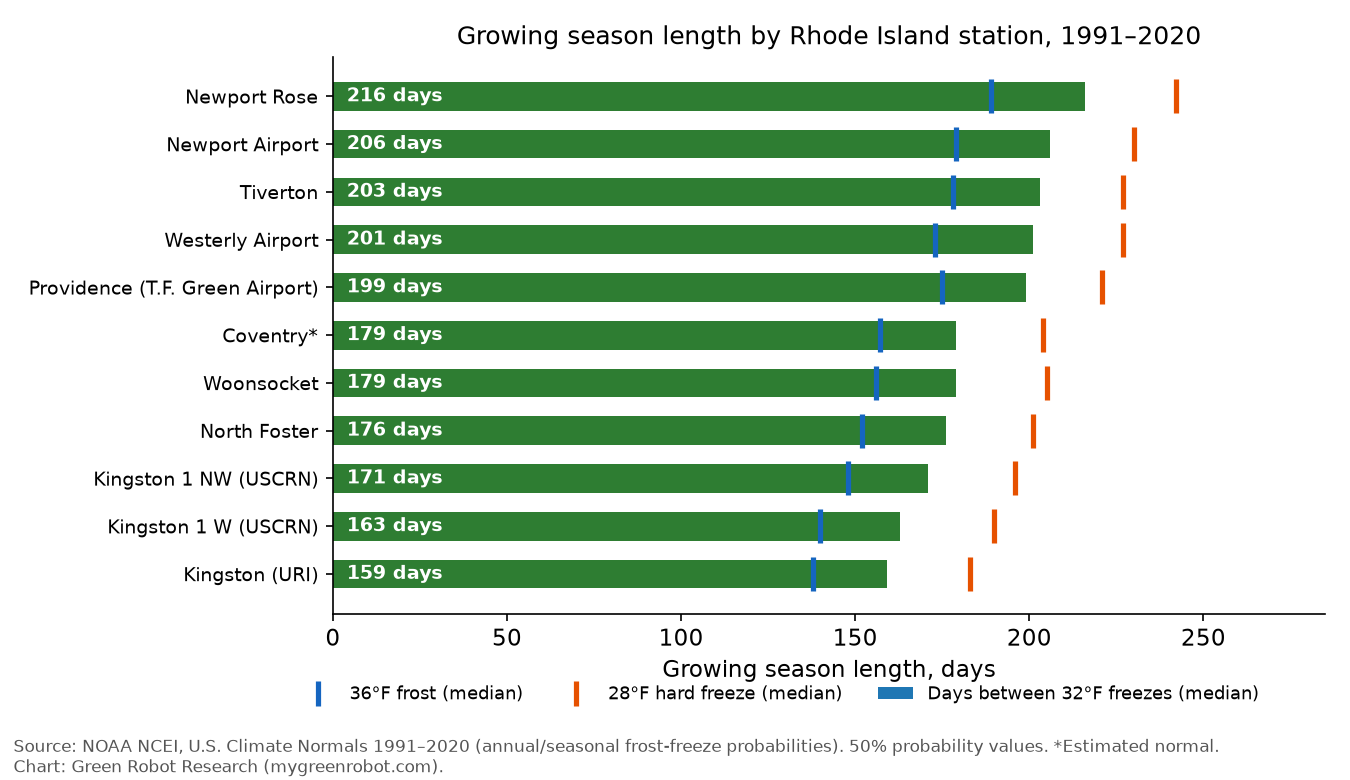
Source: NOAA NCEI 1991–2020 annual/seasonal normals, 50% probability growing season length.
The median stretch between the last spring and first fall 32°F freeze ranges from 159 days at Kingston to 216 days at Newport Rose. At T.F. Green it is 199 days, and in 9 of 10 years it is at least 183 days. At Kingston it reaches at least 142 days in 9 of 10 years. Between 36°F frosts, every station's season is about three to four weeks shorter, which matters for long-season crops such as winter squash.
5. Hardiness zones: 6b inland, 7a near the water
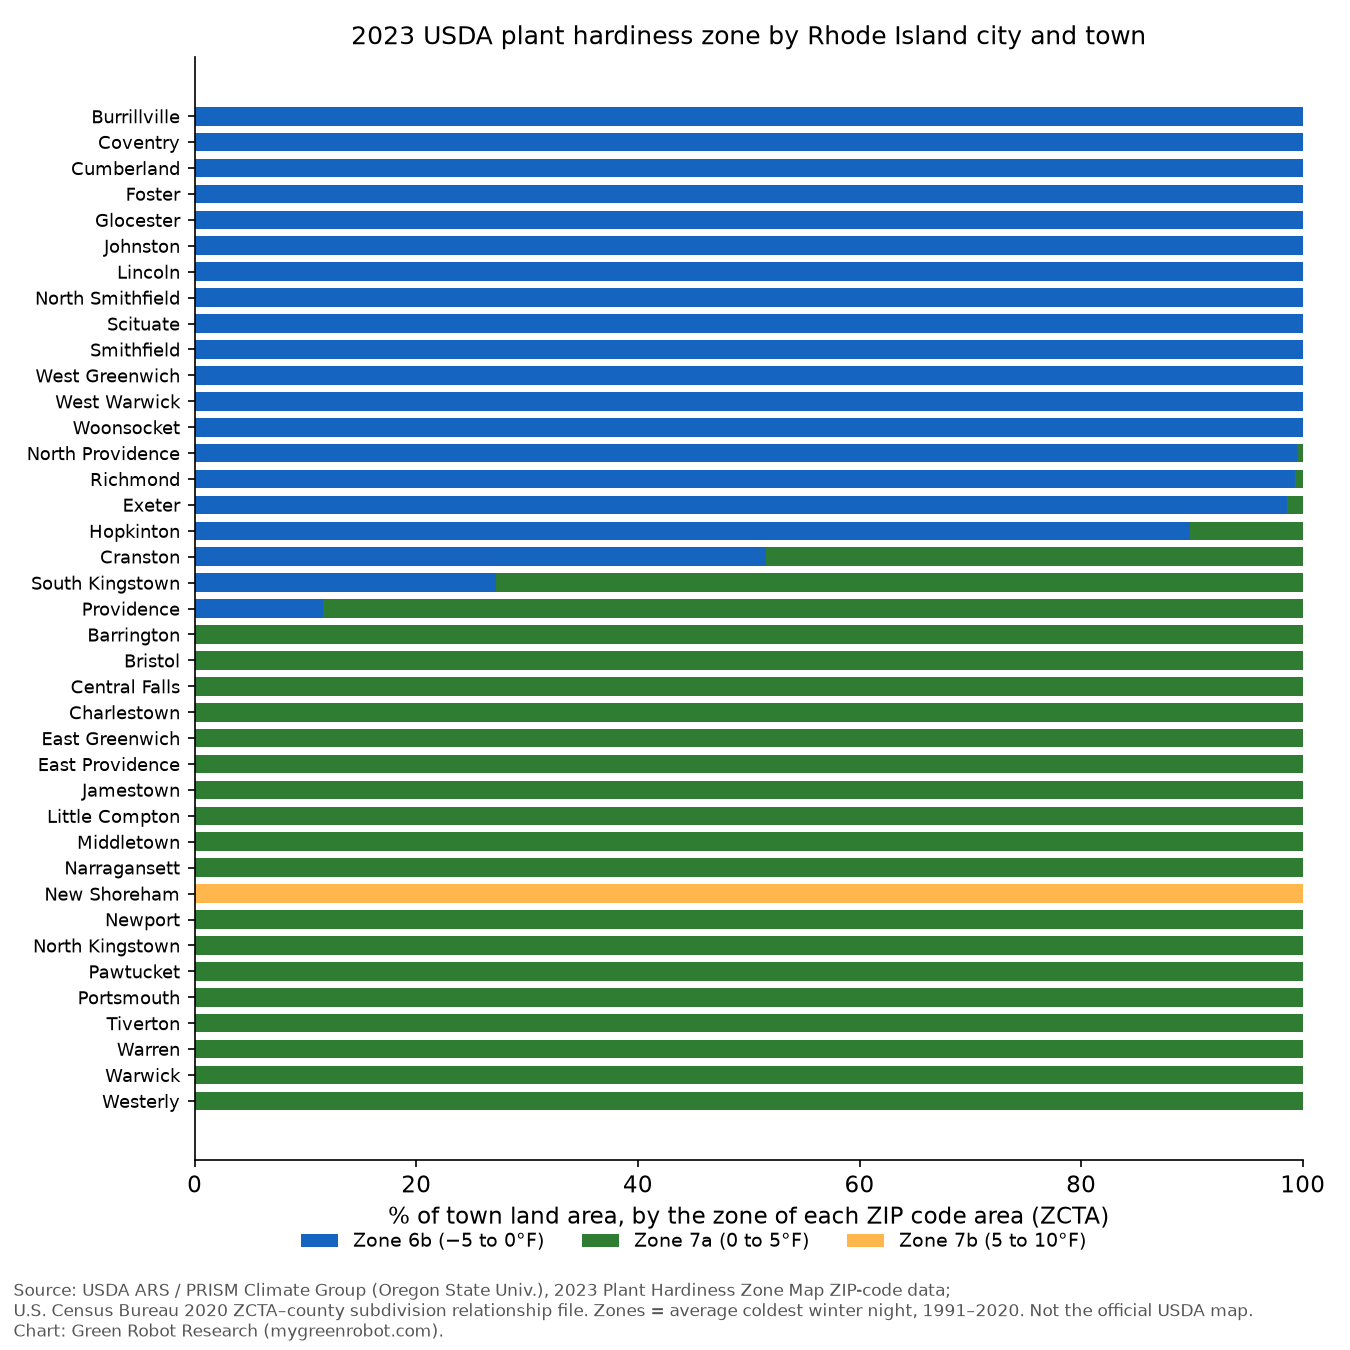
Source: USDA ARS / PRISM Climate Group, 2023 Plant Hardiness Zone Map ZIP-code data; Census 2020 ZCTA–county subdivision relationship file. Not the official USDA map.
Hardiness zones describe winter, not frost dates. They come from the average coldest night of the year over 1991–2020. Zone 6b means an average annual low of −5 to 0°F, 7a means 0 to 5°F and 7b means 5 to 10°F (USDA Plant Hardiness Zone Map; how to use the maps). In the 2023 ZIP-code data, 47 of Rhode Island's 88 ZIP codes are 7a, 40 are 6b and one, Block Island (02807), is 7b. The 7a areas follow Narragansett Bay, the East Bay, Aquidneck Island and the South County shore, along with Providence, Pawtucket and East Providence. The northwest, most of Kent County and western Washington County are 6b. Cranston is split roughly in half, and about a quarter of South Kingstown's land is 6b. Zones guide which perennials, shrubs and trees survive winter; they say nothing about when to plant tomatoes.
6. The year in temperatures and rain
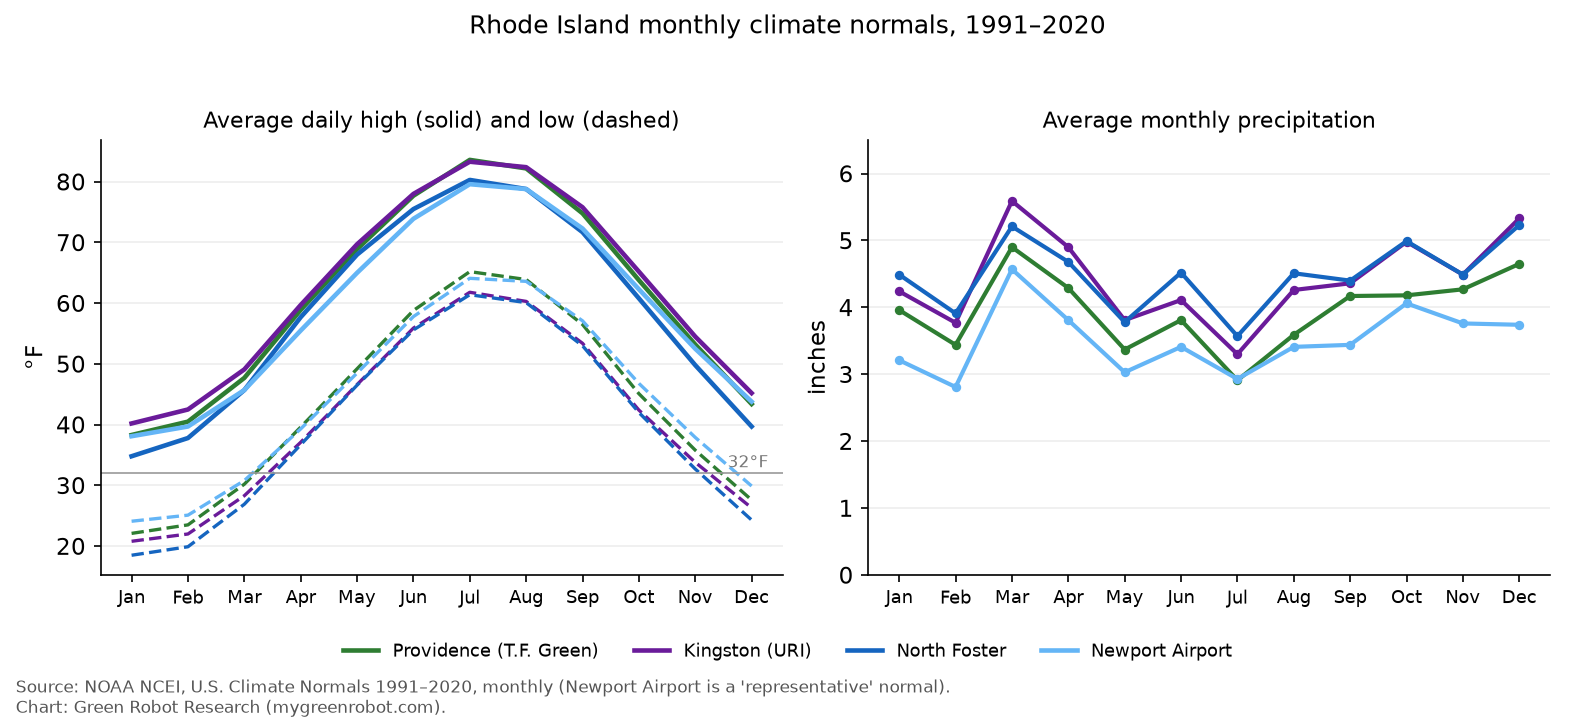
Source: NOAA NCEI, U.S. Climate Normals 1991–2020, monthly.
At T.F. Green, average lows climb from 22.1°F in January to 49.2°F in May and 65.2°F in July. Normal precipitation is 47.5 inches a year at T.F. Green and about 53 inches at Kingston and North Foster, spread fairly evenly, with July driest (2.91 inches at T.F. Green). Nights at or below freezing tell the same story: in April, T.F. Green averages 4.1, North Foster 9.0 and Kingston 9.8. In October the averages are 1.4, 4.1 and 6.1 (NCEI monthly normals).
7. Month-by-month lawn and garden calendar

This calendar adds detail to the short timing table in the Green Robot Rhode Island lawn care cost guide. Lawn advice comes from URI Cooperative Extension first, with UMass and UConn where URI is silent. Inland gardeners (zone 6b, later frost dates) should lean toward the later end of each window.
Rhode Island yard and garden calendar
| Month | Lawn | Garden, beds and shrubs | Source |
|---|---|---|---|
| Jan–Feb | Snow removal season (Dec–Mar). Plan seed and soil-test needs for spring. | Order seeds. Check the planting calendar against your nearest station's frost dates. | Green Robot cost guide; URI planting calendar |
| March | Spring cleanup from late March once the ground firms up. Rake off matted leaves to limit snow mold. Lime if a soil test calls for it. No fertilizer before green-up. | Direct-seed peas and spinach from about mid-March. | Green Robot cost guide; UConn; URI GE Hotline; URI planting calendar |
| April | Mowing usually starts mid-April. Remove no more than ⅓ of the blade. Crabgrass pre-emergent as forsythia blooms fade (late April–early May). Spring seeding only if necessary, late April. | Mulch beds 2–3 inches, kept off trunks (Apr–May). Cool-season crops keep going in. | Green Robot cost guide; UMass; URI GE Hotline |
| May | Mow weekly at 3 inches or higher, leaving clippings. If you feed in spring, do it after green-up with slow-release product at a reduced rate. Grub treatment in late May only if more than 8 grubs per sq ft. | Tender transplants (tomatoes, peppers) after May 15, late May inland. Prune rhododendrons as flowers fade. | URI Healthy Lawn Care; URI GE Hotline; URI planting calendar |
| June | Keep mowing high. Water no more than 1 inch a week, rain included. Preventive grub products only where grubs were a problem (mid-June–early Aug). | Hedge trimming after new growth has come in. | URI Healthy Lawn Care; UMass; Green Robot cost guide |
| July | Avoid mid-summer fertilizing. Scout for grubs late July–late Aug. | July is the driest month on average, so water by the inch. | URI Healthy Lawn Care; UMass; NCEI |
| August | Seeding window opens mid-August. Curative grub treatment mid-Aug–mid-Sep if counts average 5–10+ per sq ft. | No fertilizer on shrubs in late summer. Last hedge shape-up by early September. | URI GE Hotline; UMass; Green Robot cost guide |
| September | The best month for lawns. Seed or overseed by Sept. 30. Aerate or dethatch. If you fertilize once a year, do it now (through mid-October). Treat broadleaf weeds in fall. | Divide perennials (Sept–mid-Oct). Watch for early frost inland. | URI GE Hotline; UMass; RI DEM |
| October | Last nitrogen by Oct. 15. Mulch-mow leaves into the lawn or rake them. Lower the mowing height to about 2½ inches late in the season. Blow out irrigation lines before the first hard freeze. | Plant garlic and spring bulbs. Fall cleanup Oct–Nov. | URI; UConn; URI planting calendar; Green Robot cost guide |
| November | Keep mowing until the grass stops growing (usually early November). Don't leave a thick leaf mat over winter. Lime is fine while the ground isn't frozen. | Clean gutters after leaf drop. Shredded leaves make good bed mulch. | URI GE Hotline; UMass; UConn; Green Robot cost guide |
| December | Snow removal season. Soil tests can wait until the ground thaws. | Leaves 4–6 inches deep in beds, kept 6 inches from plant crowns. | Green Robot cost guide; UMass; UConn |
Sources: URI GE Hotline FAQ; URI Healthy Lawn Care; URI planting calendar; UMass turf BMP calendar; UMass crabgrass options; UMass turf insect timing; UConn organic lawn care; UConn leaf mulch mowing; RI DEM September tip; Green Robot RI lawn care costs.
Spring. URI's Gardening & Environmental Hotline ties crabgrass control to the forsythia: apply pre-emergent as the blooms begin to fade (URI GE Hotline FAQ). UMass adds that most pre-emergents prevent reseeding for 3–4 months (UMass), so pick spring crabgrass control or spring seeding, not both.
Mowing. In the Green Robot cost guide, weekly mowing is concentrated in May through September, and the season usually runs from mid-April to early November. URI's Healthy Lawn Care page recommends leaving the grass at least 3 inches tall and returning clippings (URI). UConn notes that clippings supply about a third of a lawn's nitrogen needs and that a 3-inch height helps shade out crabgrass (UConn).
Fertilizer. The guidance here varies more than anywhere else, so it helps to see it side by side:
- URI: "If you like the lawn you have, don't fertilize." If you do, use no nitrogen before spring green-up or after October 15, skip mid-summer, use slow-release product at half to a third of the label rate, and stay at or below 2 lb of nitrogen per 1,000 sq ft per year on established lawns. Use phosphorus-free fertilizer unless a soil test calls for phosphorus (URI Healthy Lawn Care).
- RI DEM: if you fertilize more than once a year, cut back to once, in September to mid-October, with slow-release product (RI DEM).
- UConn: about 1 lb of nitrogen per 1,000 sq ft, applied after April 15 and before October 15, typically once in spring and once in fall. Avoid feeding after mid-October because of snow mold risk (UConn).
- UMass: once a year in early fall, twice in spring and early fall, or three times in spring, early fall and late fall (UMass BMP calendar).
The Green Robot cost guide notes that professional programs are usually split into 3 or 4 feedings (April, late May, September, late October). That pattern is close to the UMass three-visit schedule. Homeowners who want to follow URI and RI DEM's water-quality guidance can drop to one or two feedings and keep nitrogen out of late-season applications.
Grubs. URI says grubs feed in April and May and that late May is the time to treat, but only if you find more than 8 per square foot (URI GE Hotline). UMass gives the summer timing: preventive neonicotinoids while adult beetles lay eggs (mid-June to early August), or curative products from mid-August to mid-September where counts average 5 to 10 or more per square foot (UMass).
Fall. URI's seeding window runs from mid-August through September 30. For leaves, UConn found that mulching a 2-inch layer into the lawn returned about 3.4 lb of nitrogen per 1,000 sq ft. A thick mat left over winter invites snow mold (UConn). Irrigation should be blown out before the first hard freeze (Green Robot cost guide). Inland, the median first 28°F night comes on October 20 at Kingston and October 30–31 at North Foster and Woonsocket, compared with November 9 at T.F. Green. Inland properties should therefore aim for the October end of the "October to early November" window.
8. Free ways to garden smarter with the frost data
- Plant by the 1-in-10 date, not the median. At the median, there is still a 50% chance of a later freeze.
- Watch the forecast in May. The National Weather Service issues frost advisories and freeze warnings for Rhode Island only between May 1 and October 11; outside those dates RI DEM advises following the local temperature forecast (RI DEM). An old sheet over tender plants on a clear, calm night costs nothing.
- Get a soil test before buying lime or fertilizer. URI recommends testing every couple of years. UMass says soil can be tested any time the ground isn't frozen (URI GE Hotline; UMass).
- Leave the clippings and mulch the leaves. Both return nitrogen for free (UConn; UConn leaves).
- Water by the inch. URI's limit is 1 inch a week including rain (URI). A tuna can on the lawn measures it.
- Ask URI for free. URI's Gardening & Environmental Hotline (1-800-448-1011) answers home garden questions, and URI runs a Master Gardener program (URI GE Hotline; URI Master Gardeners).
- Keep a 25-foot buffer next to water. URI recommends leaving a 25-foot buffer along ponds, streams and wetlands (URI).
Data limitations
- Stations are not towns. Rhode Island has 11 stations with 1991–2020 frost normals, and only three are "standard" normals with 24 or more years of data: T.F. Green, Kingston and North Foster. The others are "representative" (10 or more years, gaps filled from neighbors). Coventry is "estimated" from 4 years. RI DEM lists the Newport Rose, Tiverton and Coventry stations as closed.
- Microclimates matter. Frost settles in low spots on still, clear nights; the two reference stations near Kingston differ by several days. Slopes, pavement, water and tree cover all shift local dates.
- Normals are not forecasts. They describe 1991–2020. Any given year can fall outside the 10%–90% range, as the records above show. Check the forecast before planting.
- Medians versus averages. NCEI publishes probability (median) dates. RI DEM publishes averages from the same 1991–2020 normals, so its dates differ by a few days. Examples: T.F. Green last freeze, DEM April 12 versus NCEI median April 11; Kingston, May 6 versus May 3; North Foster, April 28 versus April 25. Block Island has only RI DEM's 1981–2010 averages.
- Zones by ZIP code. Town zones come from ZIP-code (ZCTA) zones weighted by land area; ZIPs don't follow town lines and can hide warmer or colder pockets. For an exact address, use the official map at planthardiness.ars.usda.gov. Some commercial zone sites differ slightly by town.
- Extension advice differs. URI, UMass and UConn differ on details such as fertilizer frequency. URI's Healthy Lawn Care page itself says both "at least 3 inches" and "between 2 and 3 inches" for mowing height.
How we calculated
- Frost dates and season length: read directly from NCEI's 1991–2020 annual/seasonal normals for each Rhode Island station (fields ANN-TMIN-PRBLST, PRBFST and PRBGSL at 28, 32 and 36°F, probability levels 10%–90%), with completeness flags. NCEI derives them from 10,000 bootstrapped simulations of each station's record (methodology).
- Monthly freeze chances, freeze nights, temperatures and precipitation: from NCEI 1991–2020 monthly normals (MLY-TMIN-PRBOCC-LSTH032/036, MLY-TMIN-AVGNDS-LSTH032, MLY-TMAX/TMIN/PRCP-NORMAL).
- Nearest station: straight-line distance from each town's Census 2023 Gazetteer center point to each station's coordinates. Coventry's station (4 years) and the two federal reference-network stations were excluded from the matching.
- Zones by town: each 2020 ZCTA's 2023 zone from PRISM's ZIP file, weighted by the land area each ZCTA shares with each town in the Census relationship file. "Main zone" covers the largest share of land.
- Charts and derived tables were made with
make_charts_frost.py. Raw and derived files are indata/frost/.
About the author. Rafael Escobar is the founder of Green Robot (mygreenrobot.com) and has 7 years of experience in landscaping. Green Robot publishes Rhode Island home and yard data built only from public sources, each one linked.
Sources
- NOAA NCEI, U.S. Climate Normals (overview): https://www.ncei.noaa.gov/products/land-based-station/us-climate-normals
- NOAA NCEI, 1991–2020 annual/seasonal normals, station files (USW00014765, USC00374266, USC00375270, USW00014787, USW00014794, USC00379423, USC00377581, USC00375215, USC00371875, USW00054796, USW00054797): https://www.ncei.noaa.gov/data/normals-annualseasonal/1991-2020/access/
- NOAA NCEI, 1991–2020 monthly normals, station files: https://www.ncei.noaa.gov/data/normals-monthly/1991-2020/access/
- NOAA NCEI, annual/seasonal normals documentation: https://www.ncei.noaa.gov/data/normals-annualseasonal/1991-2020/doc/Normals_ANN_Documentation_1991-2020.pdf ; calculation methodology: https://www.ncei.noaa.gov/data/normals-annualseasonal/1991-2020/doc/Normals_Calculation_Methodology_2020.pdf
- RI DEM, Frost Climatology: https://dem.ri.gov/environmental-protection-bureau/air-resources/climatology/frost-climatology
- USDA ARS, Plant Hardiness Zone Map: https://planthardiness.ars.usda.gov/home ; how to use the maps: https://planthardiness.ars.usda.gov/pages/how-to-use-the-maps
- PRISM Climate Group (Oregon State University), 2023 PHZM data: https://prism.oregonstate.edu/phzm/ ; ZIP-code file: https://prism.oregonstate.edu/phzm/data/2023/phzm_us_zipcode_2023.csv
- U.S. Census Bureau, 2020 ZCTA to county subdivision relationship file: https://www2.census.gov/geo/docs/maps-data/data/rel2020/zcta520/tab20_zcta520_cousub20_natl.txt ; 2023 Gazetteer files: https://www.census.gov/geographies/reference-files/time-series/geo/gazetteer-files.html
- URI Cooperative Extension, RI Planting Calendar for Fruits and Vegetables: https://web.uri.edu/coopext/wp-content/uploads/sites/2042/R03_-RI-Planting-Calendar-for-Fruits-and-Vegetables_factsheet.pdf
- URI Gardening & Environmental Hotline FAQ: https://web.uri.edu/coopext/services/ge-hotline/faq-hotline/
- URI, Healthy Lawn Care: https://web.uri.edu/safewater/protecting-water-quality-at-home/sustainable-landscaping/healthy-lawn-care/
- URI Master Gardener Program: https://web.uri.edu/mastergardener/
- RI DEM, Stormwater Solutions monthly tip, September: https://dem.ri.gov/ri-stormwater-solutions/stormwater-managers/educational-materials/by-type/short-articles-monthly-tips/monthly-tip-sep.php
- UMass Extension, Turf BMP Appendix B, calendar for cultural practices: https://www.umass.edu/agriculture-food-environment/turf/publications-resources/best-management-practices/appendix-b-calendar-for-cultural-practices-related-activities
- UMass Extension, Crabgrass management, homeowner options: https://www.umass.edu/agriculture-food-environment/home-lawn-garden/fact-sheets/crabgrass-management-homeowner-options
- UMass Extension, Turf insect management with insecticides: https://www.umass.edu/agriculture-food-environment/book/export/html/9745
- UConn Home & Garden Education Center, Organic Lawn Care: https://homegarden.cahnr.uconn.edu/factsheets/organic-lawn-care/
- UConn IPM, Leaf Disposal and Mulch Mowing: https://ipm.cahnr.uconn.edu/leaf_disposal_mulch_mowing/
- Green Robot, Rhode Island lawn care costs (yard calendar): https://mygreenrobot.com/ri/lawn-care-costs
Charts by Green Robot Research from the public data above. Free to reuse with credit: "Chart: Green Robot Research (mygreenrobot.com)". Chart code: make_charts_frost.py.